
Portfolio Details
Project information
- Category: Data Visualization
- Project name: Investment Firm Dashboard
- View Project on GitHub
- View Dashboard on Tableau
About This Project
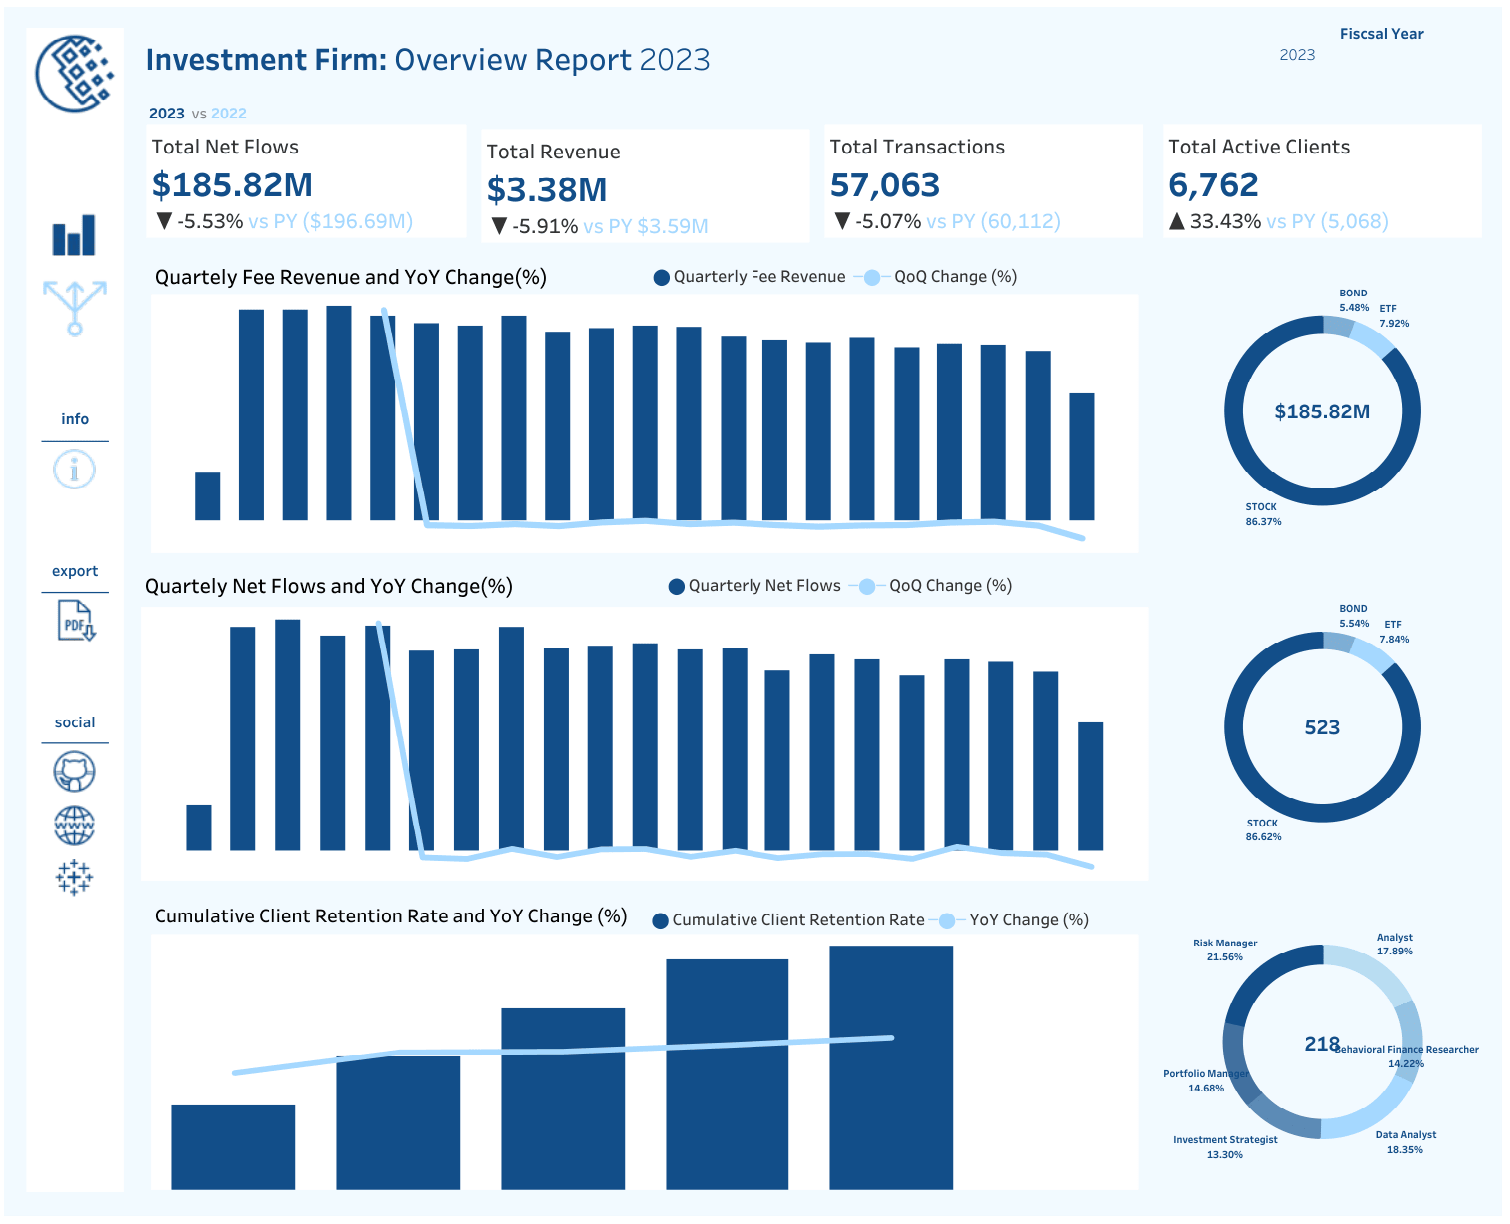
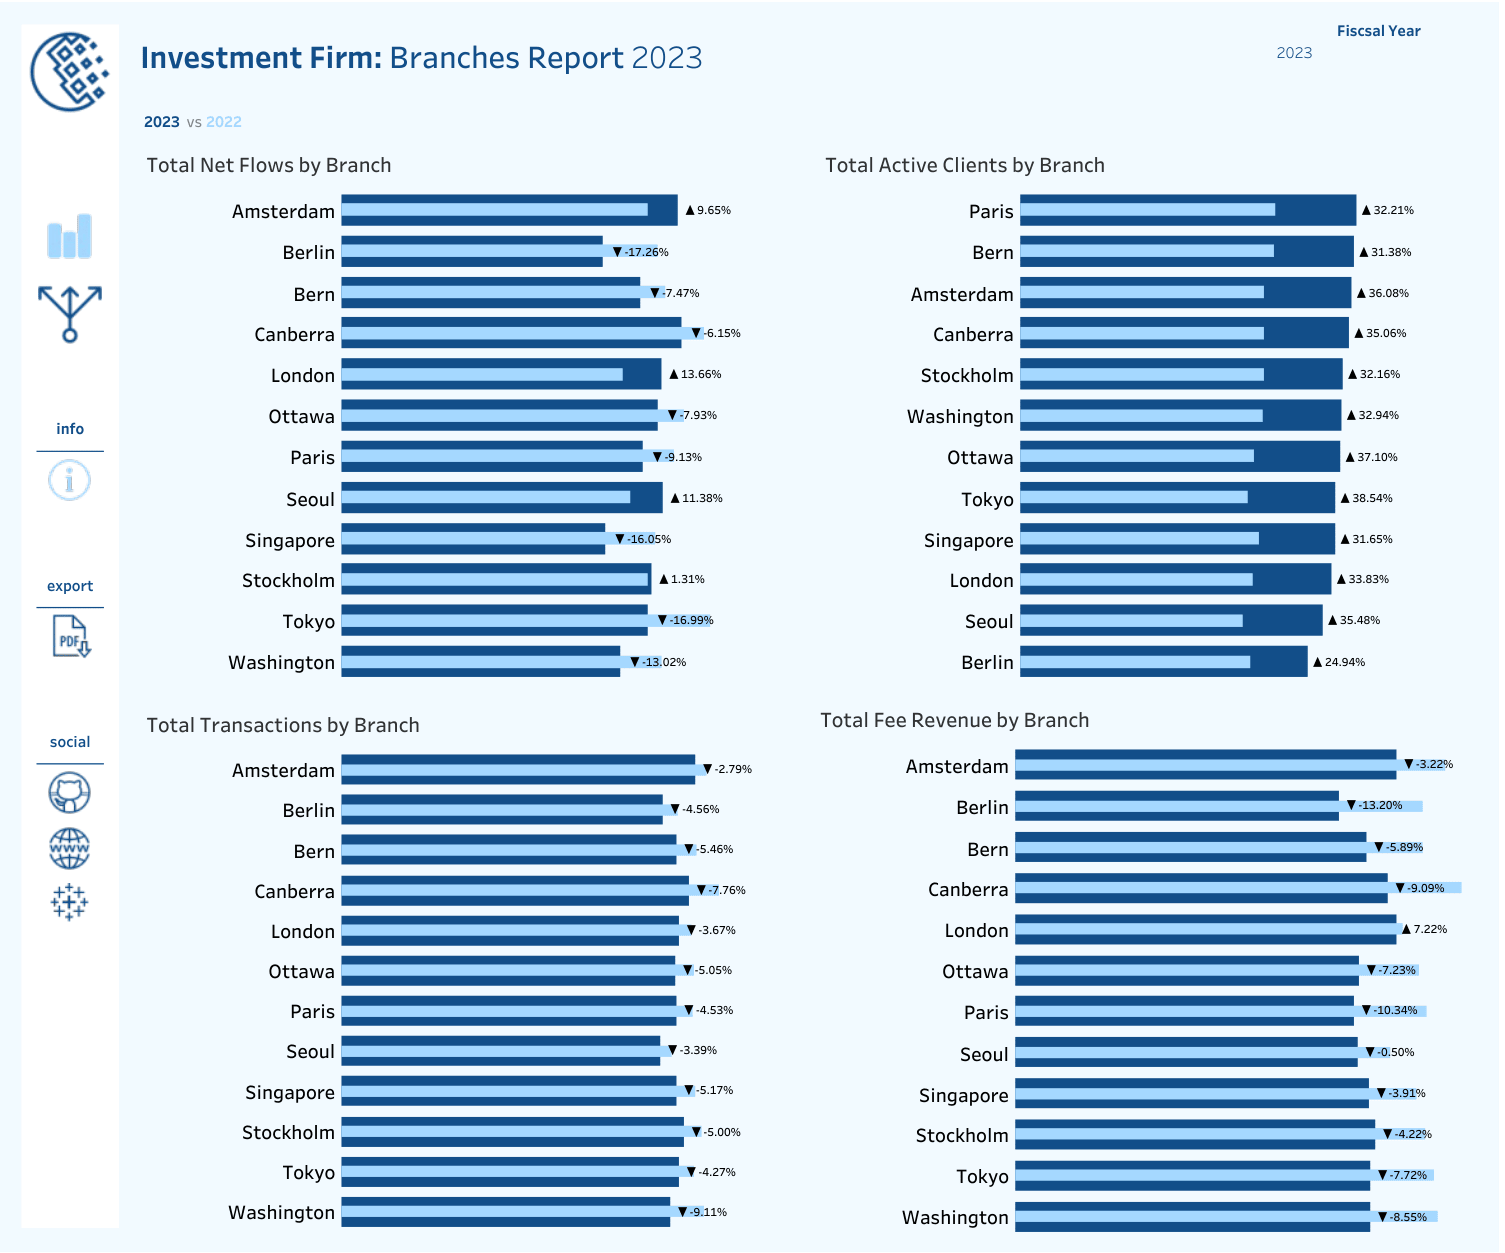
This Performance & Operations Dashboard in Tableau for an investment firm presents key performance indicators (KPIs) with year-over-year (YoY) changes, tracks quarterly Net Flows and Fee Revenues, showing YoY Growth, highlights cumulative client retention rates assessing the client base, and compares branch performance across key metrics. It offers a clear, data-driven view of the firm’s growth, client loyalty, and operational efficiency.